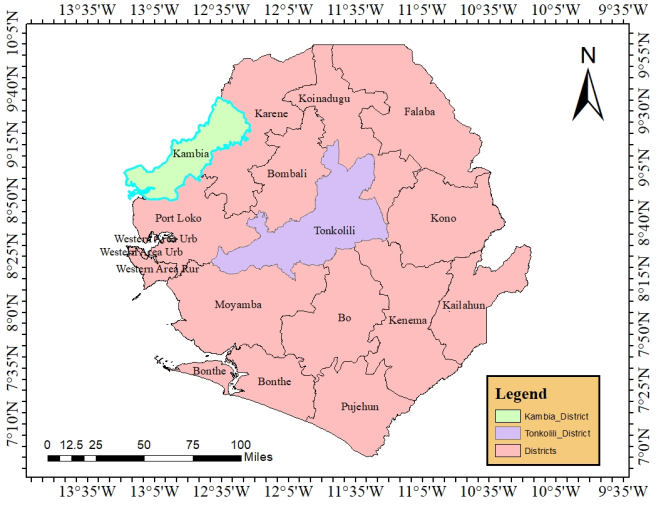
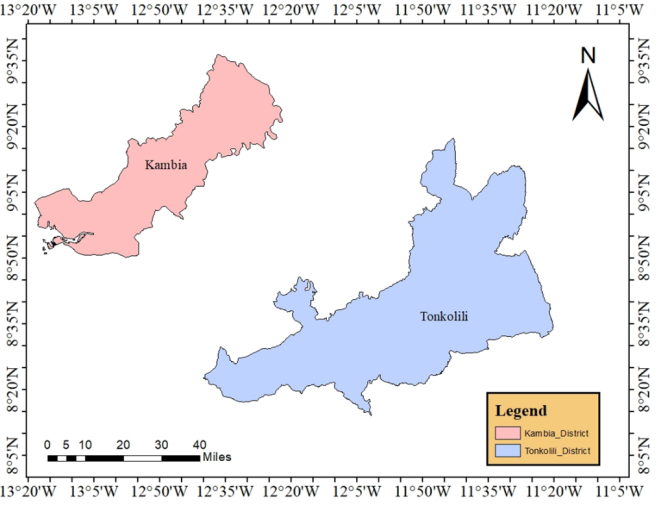
The aim of the study was to compare the physico-chemical characteristics of drinking water quality in two districts in Sierra Leone. Water samples were collected for three months (September to November) across five sampling locations. These samples were then examined for a number of physico-chemical characteristics, including temperature, pH, turbidity, electrical conductivity, dissolved oxygen, salinity, total dissolved solids (TDS), nitrate, residual chlorine, aluminum, copper, fluoride, iron, arsenic, cadmium, lead, nickel, and mercury. The statistical values for the following parameters above were found to be within the WHO permissible values for both the Tonkolili and Kambia districts. However, some parameters exceeded the recommended WHO permissible limit for drinking water in the two districts: arsenic (2.36mg/l and 0.27mg/l), cadmium (3.69mg/l and 6.63), lead (3.03mg/l and 6.64mg/l), and mercury (1.21mg/l and 2.19mg/l) for Tonkolili and Kambia districts respectively, although the statistical standard deviation is very negligible for all four parameters. In terms of comparison between the two districts, the statistical values for salinity (0.00ppt and 0.00ppt) and iron (0.05mg/l and 0.35mg/l) for both Tonkolili and Kambia districts are within the WHO permissible limit for the samples collected in the Tonkolili district, while the samples collected in the Kambia district exceeded the recommended WHO permissible limit for the two parameters. Moreover, the statistical value for copper (4.44mg/l) exceeded the WHO standard for the samples collected in the Tonkolili district, while the samples collected from the Kambia district are found within the WHO standard for copper (0.002mg/l). conclusively, this study found that all water samples collected and examined in the two districts are safe and fit for drinking and domestic purposes. The author recommends that there should be regular monitoring and treatment (for instance, chlorinating) of the hand-dug wells and tap waters and also that other researchers undertake further studies in different seasons and also to consider other water quality parameters like the bacteriological parameters, radiological materials, etc.
| Published in | World Journal of Applied Chemistry (Volume 10, Issue 1) |
| DOI | 10.11648/j.wjac.20251001.11 |
| Page(s) | 1-17 |
| Creative Commons |
This is an Open Access article, distributed under the terms of the Creative Commons Attribution 4.0 International License (http://creativecommons.org/licenses/by/4.0/), which permits unrestricted use, distribution and reproduction in any medium or format, provided the original work is properly cited. |
| Copyright |
Copyright © The Author(s), 2025. Published by Science Publishing Group |
Drinking Water, Water Quality, Physico-chemical Properties, WHO Standard, Sierra Leone
Parameters | Samples | Mean () | Stdev.S () | Var.S () | WHO | ||||
|---|---|---|---|---|---|---|---|---|---|
Up stream | Middle Stream | Down Stream | Hand Dug Well | Tap Water | |||||
Water Temperature (°C) | 25.70 | 25.33 | 25.30 | 24.73 | 24.30 | 25.06 | 0.55 | 0.31 | - |
pH (pH Units) | 7.15 | 6.79 | 7.04 | 7.09 | 7.05 | 7.02 | 0.14 | 0.02 | 6.5-8.5 |
Turbidity (NTU) | 6.29 | 5.80 | 4.82 | 0.42 | 4.15 | 4.30 | 2.32 | 5.39 | <5.0 |
TDS (mg/l) | 0.00 | 3.00 | 0.00 | 0.00 | 0.00 | 0.60 | 1.34 | 1.80 | 500 |
Dissolved Oxygen (% Sat.) | 89.30 | 88.60 | 67.30 | 75.50 | 85.50 | 80.27 | 9.55 | 91.14 | 80 - 120% |
Salinity (ppt) | 0.00 | 0.00 | 0.00 | 0.00 | 0.00 | 0.00 | 0.00 | 0.00 | 0 |
Electrical Conductivity (µs/cm) | 0.00 | 4.00 | 0.00 | 0.00 | 0.00 | 0.80 | 1.79 | 3.20 | 300 |
Nitrate (mg/l) | 0.00 | 0.00 | 0.00 | 0.00 | 0.00 | 0.00 | 0.00 | 0.00 | <10 |
R. Chlorine (mg/l) | 0.00 | 0.01 | 0.03 | 0.00 | 0.00 | 0.01 | 0.01 | 0.00 | 0.3-0.5 |
Aluminum (mg/l) | 0.00 | 0.00 | 0.00 | 0.00 | 0.00 | 0.00 | 0.00 | 0.00 | <0.2 |
Copper (mg/l) | 0.00 | 0.00 | 0.00 | 3.09 | 11.05 | 2.83 | 4.79 | 22.92 | <1.0 |
Fluoride (mg/l) | 0.00 | 0.00 | 0.00 | 0.00 | 0.00 | 0.00 | 0.00 | 0.00 | <1.5 |
Iron (mg/l) | 0.00 | 0.00 | 0.00 | 0.00 | 0.00 | 0.00 | 0.00 | 0.00 | <0.3 |
Arsenic (mg/l) | 1.15 | 0.32 | 0.00 | 3.59 | 11.75 | 3.36 | 4.90 | 23.97 | 0.01 |
Cadmium (mg/l) | 2.84 | 2.82 | 8.41 | 1.51 | 4.06 | 3.34 | 2.66 | 7.09 | 0.01 |
Lead (mg/l) | 2.84 | 2.82 | 8.41 | 1.51 | 4.06 | 3.34 | 2.66 | 7.09 | 0.1 |
Nickel (mg/l) | 0.01 | 0.00 | 0.00 | 0.00 | 0.01 | 0.00 | 0.01 | 0.00 | 0.05 |
Mercury (mg/l) | 1.05 | 0.55 | 4.52 | 11.32 | 3.39 | 2.51 | 4.32 | 18.67 | 0.001 |
Parameters | Samples | Mean () | Stdev.S () | Var.S () | WHO | ||||
|---|---|---|---|---|---|---|---|---|---|
Up stream | Middle Stream | Down Stream | Hand Dug Well | Tap Water | |||||
Water Temperature (°C) | 23.63 | 23.80 | 23.80 | 23.00 | 23.25 | 23.49 | 0.36 | 0.13 | - |
pH (pH Units) | 6.92 | 6.98 | 6.93 | 4.60 | 7.02 | 6.41 | 1.06 | 1.12 | 6.5-8.5 |
Turbidity (NTU) | 4.44 | 4.07 | 12.10 | 6.29 | 0.35 | 3.44 | 4.30 | 18.47 | <5.0 |
TDS (mg/l) | 3.00 | 0.00 | 0.00 | 0.00 | 0.00 | 0.60 | 1.34 | 1.80 | 500 |
Dissolved Oxygen (% Sat.) | 90.00 | 88.20 | 86.00 | 88.50 | 101.10 | 90.61 | 5.95 | 35.45 | 80 - 120% |
Salinity (ppt) | 0.00 | 0.00 | 0.00 | 0.00 | 0.00 | 0.00 | 0.00 | 0.00 | 0 |
Electrical Conductivity (µs/cm) | 5.00 | 0.00 | 0.00 | 0.00 | 4.00 | 1.80 | 2.49 | 6.20 | 300 |
Nitrate (mg/l) | 0.016 | 0.012 | 0.00 | 0.00 | 0.017 | 0.01 | 0.01 | 0.00 | <10 |
R. Chlorine (mg/l) | 0.00 | 0.00 | 0.00 | 0.00 | 0.00 | 0.00 | 0.00 | 0.00 | 0.3-0.5 |
Aluminum (mg/l) | 0.00 | 0.00 | 0.00 | 0.00 | 0.00 | 0.00 | 0.00 | 0.00 | <0.2 |
Copper (mg/l) | 4.34 | 2.45 | 2.12 | 1.68 | 53.04 | 12.73 | 22.56 | 508.91 | <1.0 |
Fluoride (mg/l) | 0.00 | 0.00 | 0.00 | 0.00 | 0.10 | 0.02 | 0.04 | 0.00 | <1.5 |
Iron (mg/l) | 0.00 | 0.00 | 0.00 | 0.02 | 0.40 | 0.08 | 0.18 | 0.03 | <0.3 |
Arsenic (mg/l) | 0.01 | 0.00 | 0.66 | 8.41 | 0.39 | 1.89 | 3.65 | 13.34 | 0.01 |
Cadmium (mg/l) | 0.98 | 107.18 | 4.05 | 2.26 | 1.51 | 4.29 | 46.96 | 2205.51 | 0.01 |
Lead (mg/l) | 0.98 | 107.18 | 4.05 | 2.26 | 1.51 | 4.29 | 46.96 | 2205.51 | 0.10 |
Nickel (mg/l) | 0.00 | 0.00 | 0.00 | 0.00 | 0.01 | 0.00 | 0.00 | 0.00 | 0.05 |
Mercury (mg/l) | 2.83 | 1.08 | 0.58 | 0.64 | 0.13 | 0.68 | 1.05 | 1.10 | 0.00 |
Parameters | Samples | Mean () | Stdev.S () | Var.S () | WHO | ||||
|---|---|---|---|---|---|---|---|---|---|
Up stream | Middle Stream | Down Stream | Hand Dug Well | Tap Water | |||||
Water Temperature (°C) | 24.67 | 24.57 | 24.55 | 23.87 | 23.78 | 24.28 | 0.43 | 0.18 | - |
pH (pH Units) | 7.04 | 6.89 | 6.99 | 5.85 | 7.04 | 6.75 | 0.51 | 0.26 | 6.5-8.5 |
Turbidity (NTU) | 5.37 | 4.94 | 8.46 | 3.35 | 2.25 | 4.42 | 2.36 | 5.58 | <5.0 |
TDS (mg/l) | 2.00 | 0.00 | 0.00 | 0.00 | 0.00 | 0.40 | 0.89 | 0.80 | 500.00 |
Dissolved Oxygen (% Sat.) | 89.65 | 88.40 | 76.65 | 82.00 | 93.30 | 85.79 | 6.63 | 43.95 | 80 - 120% |
Salinity (ppt) | 0.00 | 0.00 | 0.00 | 0.00 | 0.00 | 0.00 | 0.00 | 0.00 | 0.00 |
Electrical Conductivity (µs/cm) | 5.00 | 0.00 | 0.00 | 0.00 | 3.00 | 1.60 | 2.30 | 5.30 | 300 |
Nitrate (mg/l) | 0.02 | 0.01 | 0.00 | 0.00 | 0.02 | 0.01 | 0.01 | 0.00 | <10 |
R. Chlorine (mg/l) | 0.00 | 0.00 | 0.00 | 0.00 | 0.00 | 0.00 | 0.00 | 0.00 | 0.3-0.5 |
Aluminum (mg/l) | 0.00 | 0.00 | 0.00 | 0.00 | 0.00 | 0.00 | 0.00 | 0.00 | <0.2 |
Copper (mg/l) | 5.44 | 2.65 | 3.21 | 2.68 | 58.40 | 5.92 | 24.58 | 604.22 | <1.0 |
Fluoride (mg/l) | 0.00 | 0.00 | 0.00 | 0.00 | 0.10 | 0.02 | 0.04 | 0.00 | <1.5 |
Iron (mg/l) | 0.00 | 0.00 | 0.00 | 0.01 | 0.30 | 0.06 | 0.13 | 0.02 | <0.3 |
Arsenic (mg/l) | 0.11 | 0.00 | 0.12 | 8.44 | 0.52 | 1.84 | 3.70 | 13.66 | 0.01 |
Cadmium (mg/l) | 0.86 | 105.12 | 2.03 | 1.88 | 1.41 | 3.45 | 46.32 | 2145.76 | 0.01 |
Lead (mg/l) | 0.87 | 1.7.14 | 2.05 | 1.88 | 1.41 | 1.47 | 0.53 | 0.28 | 0.1 |
Nickel (mg/l) | 0.00 | 0.00 | 0.00 | 0.00 | 0.10 | 0,02 | 0.04 | 0.00 | 0.05 |
Mercury (mg/l) | 1.83 | 1.08 | 0.48 | 0.46 | 0.11 | 0.54 | 0.68 | 0.46 | 0.001 |
Parameters | Samples | Mean () | Stdev.S () | Var.S () | WHO | ||||
|---|---|---|---|---|---|---|---|---|---|
Up stream | Middle Stream | Down Stream | Hand Dug Well | Tap Water | |||||
Water Temperature (°C) | 24.40 | 24.50 | 24.50 | 24.30 | 24.50 | 24.44 | 0.089 | 0.01 | - |
pH (pH Units) | 7.15 | 6.97 | 7.04 | 7.04 | 6.83 | 7.01 | 0.12 | 0.01 | 6.5-8.5 |
Turbidity (NTU) | 0.08 | 0.79 | 0.31 | 0.77 | 0.54 | 0.50 | 0.30 | 0.09 | <5.0 |
TDS (mg/l) | 3.00 | 211.00 | 0.00 | 0.00 | 0.00 | 42.80 | 94.04 | 8842.70 | 500 |
Dissolved Oxygen (% Sat.) | 98.50 | 98. 70 | 100.00 | 101.60 | 101.20 | 100.33 | 1.39 | 1.94 | 80 - 120% |
Salinity (ppt) | 0.00 | 0.09 | 0.00 | 0.00 | 0.00 | 0.02 | 0.04 | 0.00 | 0 |
Electrical Conductivity (µs/cm) | 5.00 | 326.00 | 0.00 | 0.00 | 0.00 | 66.20 | 145.25 | 21097.20 | 300 |
Nitrate (mg/l) | 0.00 | 0.034 | 0.00 | 0.00 | 0.01 | 0.01 | 0.01 | 0.00 | <10 |
R. Chlorine (mg/l) | 0.04 | 0.00 | 0.01 | 0.00 | 0.17 | 0.04 | 0.07 | 0.01 | 0.3-0.5 |
Aluminum (mg/l) | 0.01 | 0.00 | 0.03 | 0.00 | 0.04 | 0.02 | 0.02 | 0.00 | <0.2 |
Copper (mg/l) | 0.00 | 0.00 | 0.00 | 0.00 | 0.25 | 0.05 | 0.11 | 0.01 | <1.0 |
Fluoride (mg/l) | 0.00 | 0.00 | 0.00 | 0.00 | 0.00 | 0.00 | 0.00 | 0.00 | <1.5 |
Iron (mg/l) | 0.00 | 0.00 | 0.00 | 0.00 | 0.25 | 0.05 | 0.11 | 0.01 | <0.3 |
Arsenic (mg/l) | 0.00 | 0.01 | 0.00 | 0.00 | 0.00 | 0.00 | 0.00 | 0.00 | 0.01 |
Cadmium (mg/l) | 16.77 | 33.35 | 5.70 | 41.85 | 1.27 | 19.79 | 17.47 | 305.29 | 0.01 |
Lead (mg/l) | 16.77 | 33.35 | 5.70 | 41.85 | 1.27 | 19.79 | 17.47 | 305.29 | 0.1 |
Nickel (mg/l) | 0.00 | 0.00 | 0.00 | 0.00 | 0.00 | 0.00 | 0.00 | 0.00 | 0.05 |
Mercury (mg/l) | 2.98 | 22.28 | 0.14 | 4.84 | 2.58 | 6.56 | 8.94 | 79.99 | 0.001 |
Parameters | Samples | Mean () | Stdev.S () | Var.S () | WHO | ||||
|---|---|---|---|---|---|---|---|---|---|
Up stream | Middle Stream | Down Stream | Hand Dug Well | Tap Water | |||||
Water Temperature (°C) | 21.88 | 23.13 | 22. 75 | 23.80 | 23.50 | 23.08 | 0.84 | 0.71 | - |
pH (pH Units) | 6.86 | 7.22 | 6.97 | 6.83 | 6.80 | 6.94 | 0.17 | 0.03 | 6.5-8.5 |
Turbidity (NTU) | 0.01 | 0.01 | 0.39 | 0.11 | 0.56 | 0.216 | 0.25 | 0.06 | <5.0 |
TDS (mg/l) | 51.00 | 61.00 | 0.00 | 4.00 | 6.00 | 24.40 | 29.14 | 849.30 | 500 |
Dissolved Oxygen (% Sat.) | 101.40 | 103.90 | 101.40 | 101.50 | 102.90 | 102.22 | 1.13 | 1.29 | 80 - 120% |
Salinity (ppt) | 0.03 | 0.03 | 0.00 | 0.00 | 0.00 | 0.01 | 0.02 | 0.00 | 0 |
Electrical Conductivity (µs/cm) | 79.00 | 95.00 | 0.00 | 0.00 | 10.00 | 36.80 | 46.35 | 2148.70 | 300 |
Nitrate (mg/l) | 0.124 | 0.21 | 0.00 | 0.304 | 0.00 | 0.13 | 0.13 | 0.02 | <10 |
R. Chlorine (mg/l) | 0.21 | 0.06 | 0.36 | 0.21 | 0.20 | 0.21 | 0.11 | 0.01 | 0.3-0.5 |
Aluminum (mg/l) | 0.03 | 0.03 | 0.07 | 0.05 | 0.02 | 0.04 | 0.02 | 0.00 | <0.2 |
Copper (mg/l) | 0.00 | 0.00 | 0.00 | 0.00 | 0.00 | 0.00 | 0.00 | 0.00 | <1.0 |
Fluoride (mg/l) | 0.12 | 0.00 | 0.12 | 0.10 | 0.00 | 0.07 | 0.06 | 0.00 | <1.5 |
Iron (m/l) | 1.18 | 0.023 | 0.84 | 0.65 | 0.03 | 0.54 | 0.51 | 0.25 | <0.3 |
Arsenic (mg/l) | 0.00 | 0.00 | 0.02 | 0.00 | 2.00 | 0.40 | 0.89 | 0.80 | 0.01 |
Cadmium (mg/l) | 0.12 | 0.02 | 0.07 | 0.03 | 0.23 | 0.094 | 0.09 | 0.01 | 0.01 |
Lead (mg/l) | 0.12 | 0.02 | 0.07 | 0.03 | 0.33 | 0.11 | 0.13 | 0.02 | 0.1 |
Nickel (mg/l) | 0.00 | 0.00 | 0.00 | 0.01 | 0.00 | 0.00 | 0.00 | 0.00 | 0.05 |
Mercury (mg/l) | 0.01 | 0.01 | 0.00 | 0.00 | 0.00 | 0.00 | 0.01 | 0.00 | 0.001 |
Parameters | Samples | Mean () | Stdev.S () | Var.S () | WHO | ||||
|---|---|---|---|---|---|---|---|---|---|
Up stream | Middle Stream | Down Stream | Hand Dug Well | Tap Water | |||||
Water Temperature (°C) | 22.70 | 23.20 | 23.30 | 23.30 | 23.00 | 23.10 | 0.25 | 0.07 | - |
pH (pH Units) | 6.70 | 7.00 | 7.10 | 6.70 | 6.80 | 6.86 | 0.18 | 0.03 | 6.5-8.5 |
Turbidity (NTU) | 0.01 | 0.01 | 0.39 | 0.11 | 0.56 | 0.22 | 0.25 | 0.06 | <5.0 |
TDS (mg/l) | 16.00 | 51.00 | 12.00 | 8.00 | 11.00 | 19.60 | 17.78 | 316.30 | 500 |
Dissolved Oxygen (% Sat.) | 100.20 | 100.60 | 100.20 | 100.70 | 100.00 | 100.34 | 0.30 | 0.09 | 80 - 120% |
Salinity (ppt) | 0.01 | 0.02 | 0.00 | 0.00 | 0.00 | 0.01 | 0.01 | 0.00 | 0 |
Electrical Conductivity (µs/cm) | 80.00 | 88.00 | 17.00 | 7.00 | 9.00 | 40.20 | 40.26 | 1620.70 | 300 |
Nitrate (mg/l) | 0.02 | 0.01 | 0.02 | 0.22 | 0.02 | 0.06 | 0.09 | 0.01 | <10 |
R. Chlorine (mg/l) | 0.21 | 0.06 | 0.36 | 0.21 | 0.20 | 0.21 | 0.11 | 0.01 | 0.3-0.5 |
Aluminum (mg/l) | 0.01 | 0.01 | 0.01 | 0.01 | 0.00 | 0.01 | 0.01 | 0.00 | <0.2 |
Copper (mg/l) | 0.00 | 0.00 | 0.00 | 0.00 | 0.00 | 0.00 | 0.00 | 0.00 | <1.0 |
Fluoride (mg/l) | 0.00 | 0.00 | 0.10 | 0.10 | 0.00 | 0.04 | 0.05 | 0.00 | <1.5 |
Iron (mg/l) | 1.00 | 0.02 | 0.60 | 0.80 | 0.00 | 0.48 | 0.46 | 0.21 | <0.3 |
Arsenic (mg/l) | 0.00 | 0.00 | 0.02 | 0.00 | 2.1 | 0.42 | 0.94 | 0.88 | 0.01 |
Cadmium (mg/l) | 0.00 | 0.01 | 0.04 | 0.03 | 0.01 | 0.018 | 0.02 | 0.00 | 0.01 |
Lead (mg/l) | 0.02 | 0.01 | 0.04 | 0.03 | 0.01 | 0.02 | 0.01 | 0.00 | 0.1 |
Nickel (mg/l) | 0.00 | 0.00 | 0.00 | 0.01 | 0.00 | 0.00 | 0.00 | 0.00 | 0.05 |
Mercury (mg/l) | 0.01 | 0.01 | 0.00 | 0.00 | 0.00 | 0.00 | 0.01 | 0.00 | 0.001 |
Parameters | The mean of Physiochemical Parameters for each month in a District | WHO Permissible Limits | |||||
|---|---|---|---|---|---|---|---|
September | October | November | |||||
Tonkolili | Kambia | Tonkolili | Kambia | Tonkolili | Kambia | ||
Water Temperature (°C) | 25.06 | 24.44 | 23.49 | 23.08 | 24.28 | 23.10 | - |
pH (pH Units) | 7.02 | 7.01 | 6.41 | 6.94 | 6.75 | 6.86 | 6.5-8.5 |
Turbidity (NTU) | 1.58 | 0.50 | 3.44 | 0.216 | 4.42 | 0.22 | <5.0 |
TDS (mg/l) | 0.60 | 42.80 | 0.60 | 24.40 | 0.40 | 19.60 | 500 |
Dissolved Oxygen (% Sat.) | 80.27 | 100.33 | 90.61 | 102.22 | 85.79 | 100.34 | 80 - 120% |
Salinity (ppt) | 0.00 | 0.02 | 0.00 | 0.01 | 0.00 | 0.01 | 0.00 |
Electrical Conductivity (µs/cm) | 0.80 | 66.20 | 1.80 | 36.80 | 1.60 | 40.20 | 300 |
Nitrate (mg/l) | 0.00 | 0.01 | 0.01 | 0.13 | 0.01 | 0.06 | <10 |
R. Chlorine (mg/l) | 0.01 | 0.04 | 0.00 | 0.21 | 0.00 | 0.21 | 0.3-0.5 |
Aluminum (mg/l) | 0.00 | 0.02 | 0.00 | 0.04 | 0.00 | 0.01 | <0.2 |
Copper (mg/l) | 2.83 | 0.05 | 4.58 | 0.00 | 5.92 | 0.00 | <1.0 |
Fluoride (mg/l) | 0.00 | 0.00 | 0.02 | 0.07 | 0.02 | 0.04 | <1.5 |
Iron (mg/l) | 0.00 | 0.05 | 0.08 | 0.54 | 0.06 | 0.48 | <0.3 |
Arsenic (mg/l) | 3.36 | 0.00 | 1.89 | 0.40 | 1.84 | 0.42 | 0.01 |
Cadmium (mg/l) | 3.34 | 19.79 | 4.29 | 0.094 | 3.45 | 0.02 | 0.01 |
Lead (mg/l) | 3.34 | 19.79 | 4.29 | 0.11 | 1.47 | 0.02 | 0.1 |
Nickel (mg/l) | 0.00 | 0.00 | 0.00 | 0.00 | 0.02 | 0.00 | 0.05 |
Mercury (mg/l) | 2.51 | 6.56 | 0.68 | 0.00 | 0.54 | 0.00 | 0.001 |
Al | Aluminium |
APHA | American Public Health Associations |
As | Arsenic |
ASTM | American Society for Testing and Materials |
Cd | Cadmium |
Cu | Copper |
DO | Dissolved Oxygen |
F | Fluoride |
Fe | Iron |
Hg | Mercury |
KCl | Potassium Chloride |
NH3 | Ammonia |
Ni | Nickel |
NO2 | Nitrogen Dioxide |
NO3 | Nitrate |
NTU | Nephelometer Turbidity Unit |
Pb | Lead |
pH | Potential of Hydrogen |
PO4 | Phosphates |
TDS | Total Dissolved Solid |
WHO | World Health Organization |
Zn | Zinc |
| [1] | A. A. Meharg, P. N. Williams, E. Adomako et al., (2009): “Geographical variation in total and inorganic arsenic content of polished (white) rice,” Environmental Science and Technology, vol. 43, no. 5, pp. 1612–1617, 2009. |
| [2] | A. Azrina, H. E. Khoo, M. A. Idris, I. Amin, and M. R. Razman, “Major inorganic elements in tap water samples in Peninsular Malaysia,” Malaysian Journal of Nutrition, vol. 17, no. 2, pp. 271– 276, 2011. |
| [3] | Ali, K.; Javid, A.; Javid, M. (1996): Pollution and Industrial Waste, Lahore 6th National Congress Soil Sciences; Lahore, Pakistan; 1996, p 122. |
| [4] | APHA (1995): American Public Health Association, Standard Methods: For the Examination of Water and Wastewater, APHA, AWWA, WEF/1995, APHA Publication, 1995. |
| [5] | Dahiya, S.; Kaur, A. J. (1999) Environ Poll. 1999, 6, 281. |
| [6] | Donkor et al. (2007): Risk Factors in the Hygienic Quality of water. |
| [7] | F. N. Scatena, “Drinking water quality,” in Drinking Water from Forests and Grasslands: A Synthesis of the Scientific Literature, G. E. Dissmeyer, Ed., General Technical Report SRS-39, p. 246, Department of Agriculture, Southern Research Station, Asheville, NC, USA, 2000. |
| [8] | Fresh water watch (2024): |
| [9] | G. E. Dissmeyer (2000): Drinking water from Forests and Grasslands, South Research Station, USDA Forest Service, Ashville, NC, USA, 2000. |
| [10] | I. A. Katsoyiannis and A. I. Zouboulis (2013): “Removal of uranium from contaminated drinking water: a mini review of available treatment methods,” Desalination and Water Treatment, vol. 51, no. 13–15, pp. 2915–2925, 2013. |
| [11] | J. DeZuane (1997): Handbook of Drinking Water Quality, John Wiley & Sons, 1997. |
| [12] | J. K. Fawell (1993), “The impact of inorganic chemicals on water quality and health,” Annali dell’Istituto Superiore di Sanita, vol. 29, no. 2, pp. 293–303, 1993. |
| [13] | Khan, R.; Jadhav, M.; Ustad, I. (2012): Biosci. Discov. 2012, 3, 64. |
| [14] | Kross, B. C.; Hallberg, G. R.; Bruner, D. R.; Cherryholmes, K.; Johnson, J. K. Am. J. (1993): Public Health 1993, 83, 270. |
| [15] | M. El-Harouny, S. El-Dakroory, S. Attalla, N. Hasan, and R. Hegazy (2009): “Chemical quality of tap water versus bottled water: evaluation of some heavy metals and elements content of drinking water in Dakhlia Governorate—Egypt,” The Internet Journal of Nutrition and Wellness, vol. 9, no. 2, 2009. |
| [16] | M. Hanaa, E. A. Eweida, and F. Azza, (2000): Heavy Metals in Drinking Water and Their Environmental Impact of Human Health, 2000. |
| [17] | Maduka HCC, Chukwu NC, Ugwu CE, Dike CC, Okpogba AN, Ogueche PN and Maduka AA (2014). Assessment of commercial bottled table and sachet water commonly consumed in Federal University of Technology, Owerri (FUTO), Imo State, Nigeria using Microbiological indices. Journal of Dental and Medical Sciences 13: 86-89. |
| [18] | Magburaka, Sierra Leone | Map, Time Zone (2008): ". Archived from the original on 2011-06-17. Retrieved 2008-04-01. |
| [19] | Mihayo. I, Mkoma. S. (2012). Chemical Water Quality of Bottled Drinking Water Brands Marketed in Mwanza City, Tanzania. Research Journal of Chemical Sciences, Vol. 2(7), 21-26; ISSN 2231-606X. |
| [20] | P. Kavcar, A. Sofuoglu, and S. C. Sofuoglu, “A health risk assessment for exposure to trace metals via drinking water ingestion pathway,” International Journal of Hygiene and Environmental Health, vol. 212, no. 2, pp. 216–227, 2009. |
| [21] | Pankow, J. F. (1991): Aquatic chemistry concept. |
| [22] | Pedley, Stephen & Howard, Guy. (1997). The public health implications of microbiological contamination of groundwater. Quarterly Journal of Engineering Geology and Hydrogeology - Q J ENG GEOL HYDROGEOL. 30. 179-188. |
| [23] | Porter, D. (1991). Essay Review: Drinking Water, a Science of Impurity: Water Analysis in Nineteenth Century Britain. History of Science, 29(4), 429-432. |
| [24] | Prüss-Üstün et al. (2008): Human health and the water environment: Using the DPSEEA framework to identify the driving forces of disease. |
| [25] | R. Cidu, F. Frau, and P. Tore (2011): “Drinking water quality: comparing inorganic components in bottled water and Italian tap water,” Journal of Food Composition and Analysis, vol. 24, no. 2, pp. 184–193, 2011. |
| [26] | Republic of Sierra Leone: 2004 Population and Housing Census: Analytical Report on Population Distribution, Migration and Urbanisation in Sierra Leone. Ibrahim Mohamed Sesay, Andrew A. Karam, Jinnah J. Ngobeh. Published November 2006. |
| [27] | S. Khan, M. Shahnaz, N. Jehan, S. Rehman, M. T. Shah, and I. Din, “Drinking water quality and human health risk in Charsadda district, Pakistan,” Journal of Cleaner Production, vol. 60, pp. 93–101, 2013. |
| [28] | S. Muhammad, M. T. Shah, and S. Khan, (2011): “Health risk assessment of heavy metals and their source apportionment in drinking water of Kohistan region, Northern Pakistan,” Microchemical Journal, vol. 98, no. 2, pp. 334–343, 2011. |
| [29] | Saksena, D.; Kaushik, S. Trophic Status and Habitat Ecology of Entomofauna of Three Water Bodies at Gwalior, Madhya Pradesh in Perspective in Entomological Research, Agarwal, O.P. (Ed.), Scientific Publishers: Jodhpur, India; 1994. |
| [30] | Sawyer, D. S., Whitmarsh, R. B., Klaus, A., et al., (1994): Proceedings of the Ocean Drilling Program, Initial Reports, Vol. 149. |
| [31] | Shrinivasa, R.; Venkateswaralu P. (2000): Indian J Environ Prot. 2000, 20, 161. |
| [32] | Sierra Leone Country Details (2022): History-africa.com. Archived from the original on 11 April 2013. Retrieved 27 April 2022. |
| [33] | Sinha, S. N. (2011); Biswas, M. Asian J. Exp. Boil. Sci. 2011, 2, 18. |
| [34] | UNW-DPAC. (2015). The Human Right to Water and Sanitation, Media brief. 50014 Zaragoza, Spain, |
| [35] | WHO, UNICEF. 2015. JMP Report 2015: Key Facts. Joint World Health Organization/United Nations Children’s Fund Monitoring Program for Water Supply and Sanitation. |
| [36] | World Health Organization (WHO), (2005). Nutrients in Drinking Water. Geneva: WHO Library Cataloguing-in-Publication Data. |
| [37] | World Health Organization (WHO), (2017). Guidelines for drinking-water quality: fourth edition incorporating the first. Geneva: WHO Library Cataloguing-in-Publication Data. |
| [38] | World Health Organization, WHO Guidelines for Drinking Water, WHO Criteria and Other Supporting Information, World Health Organization: Geneva; 2008. |
| [39] | World Health Organization. (WHO). (2004). Guidelines for Drinking water. |
APA Style
Lebbie, S. E., Lawal, O., Kanneh, U. (2025). Analysis of Physico-chemical Parameters to Evaluate the Drinking Water Quality Between Two Districts Kambia and Tonkolili in Sierra Leone. World Journal of Applied Chemistry, 10(1), 1-17. https://doi.org/10.11648/j.wjac.20251001.11
ACS Style
Lebbie, S. E.; Lawal, O.; Kanneh, U. Analysis of Physico-chemical Parameters to Evaluate the Drinking Water Quality Between Two Districts Kambia and Tonkolili in Sierra Leone. World J. Appl. Chem. 2025, 10(1), 1-17. doi: 10.11648/j.wjac.20251001.11
AMA Style
Lebbie SE, Lawal O, Kanneh U. Analysis of Physico-chemical Parameters to Evaluate the Drinking Water Quality Between Two Districts Kambia and Tonkolili in Sierra Leone. World J Appl Chem. 2025;10(1):1-17. doi: 10.11648/j.wjac.20251001.11
@article{10.11648/j.wjac.20251001.11,
  author = {Sahr Emmanuel Lebbie and Olanrewaju Lawal and Umaru Kanneh},
  title = {Analysis of Physico-chemical Parameters to Evaluate the Drinking Water Quality Between Two Districts Kambia and Tonkolili in Sierra Leone},
  journal = {World Journal of Applied Chemistry},
  volume = {10},
  number = {1},
  pages = {1-17},
  doi = {10.11648/j.wjac.20251001.11},
  url = {https://doi.org/10.11648/j.wjac.20251001.11},
  eprint = {https://article.sciencepublishinggroup.com/pdf/10.11648.j.wjac.20251001.11},
  abstract = {The aim of the study was to compare the physico-chemical characteristics of drinking water quality in two districts in Sierra Leone. Water samples were collected for three months (September to November) across five sampling locations. These samples were then examined for a number of physico-chemical characteristics, including temperature, pH, turbidity, electrical conductivity, dissolved oxygen, salinity, total dissolved solids (TDS), nitrate, residual chlorine, aluminum, copper, fluoride, iron, arsenic, cadmium, lead, nickel, and mercury. The statistical values for the following parameters above were found to be within the WHO permissible values for both the Tonkolili and Kambia districts. However, some parameters exceeded the recommended WHO permissible limit for drinking water in the two districts: arsenic (2.36mg/l and 0.27mg/l), cadmium (3.69mg/l and 6.63), lead (3.03mg/l and 6.64mg/l), and mercury (1.21mg/l and 2.19mg/l) for Tonkolili and Kambia districts respectively, although the statistical standard deviation is very negligible for all four parameters. In terms of comparison between the two districts, the statistical values for salinity (0.00ppt and 0.00ppt) and iron (0.05mg/l and 0.35mg/l) for both Tonkolili and Kambia districts are within the WHO permissible limit for the samples collected in the Tonkolili district, while the samples collected in the Kambia district exceeded the recommended WHO permissible limit for the two parameters. Moreover, the statistical value for copper (4.44mg/l) exceeded the WHO standard for the samples collected in the Tonkolili district, while the samples collected from the Kambia district are found within the WHO standard for copper (0.002mg/l). conclusively, this study found that all water samples collected and examined in the two districts are safe and fit for drinking and domestic purposes. The author recommends that there should be regular monitoring and treatment (for instance, chlorinating) of the hand-dug wells and tap waters and also that other researchers undertake further studies in different seasons and also to consider other water quality parameters like the bacteriological parameters, radiological materials, etc.},
 year = {2025}
}
TY  - JOUR
T1  - Analysis of Physico-chemical Parameters to Evaluate the Drinking Water Quality Between Two Districts Kambia and Tonkolili in Sierra Leone
AU  - Sahr Emmanuel Lebbie
AU  - Olanrewaju Lawal
AU  - Umaru Kanneh
Y1  - 2025/02/10
PY  - 2025
N1  - https://doi.org/10.11648/j.wjac.20251001.11
DO  - 10.11648/j.wjac.20251001.11
T2  - World Journal of Applied Chemistry
JF  - World Journal of Applied Chemistry
JO  - World Journal of Applied Chemistry
SP  - 1
EP  - 17
PB  - Science Publishing Group
SN  - 2637-5982
UR  - https://doi.org/10.11648/j.wjac.20251001.11
AB  - The aim of the study was to compare the physico-chemical characteristics of drinking water quality in two districts in Sierra Leone. Water samples were collected for three months (September to November) across five sampling locations. These samples were then examined for a number of physico-chemical characteristics, including temperature, pH, turbidity, electrical conductivity, dissolved oxygen, salinity, total dissolved solids (TDS), nitrate, residual chlorine, aluminum, copper, fluoride, iron, arsenic, cadmium, lead, nickel, and mercury. The statistical values for the following parameters above were found to be within the WHO permissible values for both the Tonkolili and Kambia districts. However, some parameters exceeded the recommended WHO permissible limit for drinking water in the two districts: arsenic (2.36mg/l and 0.27mg/l), cadmium (3.69mg/l and 6.63), lead (3.03mg/l and 6.64mg/l), and mercury (1.21mg/l and 2.19mg/l) for Tonkolili and Kambia districts respectively, although the statistical standard deviation is very negligible for all four parameters. In terms of comparison between the two districts, the statistical values for salinity (0.00ppt and 0.00ppt) and iron (0.05mg/l and 0.35mg/l) for both Tonkolili and Kambia districts are within the WHO permissible limit for the samples collected in the Tonkolili district, while the samples collected in the Kambia district exceeded the recommended WHO permissible limit for the two parameters. Moreover, the statistical value for copper (4.44mg/l) exceeded the WHO standard for the samples collected in the Tonkolili district, while the samples collected from the Kambia district are found within the WHO standard for copper (0.002mg/l). conclusively, this study found that all water samples collected and examined in the two districts are safe and fit for drinking and domestic purposes. The author recommends that there should be regular monitoring and treatment (for instance, chlorinating) of the hand-dug wells and tap waters and also that other researchers undertake further studies in different seasons and also to consider other water quality parameters like the bacteriological parameters, radiological materials, etc.
VL  - 10
IS  - 1
ER  -
Chemistry Department, School of Basic Sciences, Njala University, Moyamba, Sierra Leone
Biography: Sahr Emmanuel Lebbie is a renowned Sierra Leonean environmentalist, an articulate and creative person with good organizational and industrial managerial skills, competent in chemical analysis, quality control, human resource development, and administrative and research works at Njala University, Department of Chemistry. He completed his master's in environmental chemistry from Njala University in 2021 and his bachelor's degree in environmental chemistry from the same university in 2019. In addition, he holds a French Certificate from IMATT College, Freetown, in 2023, and a Generic Research Competency License Supervising Certificate for the Postgraduate Supervision Course, Editorial Assistant and Technical Editing, APA Referencing, and Canons of Research from Njala University in 2024. Recognized for his exceptional skills and academic excellence, he was employed as a lecturer at Njala University and also an associate lecturer in the Health Sciences Department, Central University, Sierra Leone. He has participated in multiple international research collaboration projects in recent years. Lebbie is dedicated to advancing environmental issues and research in Sierra Leone.

Department of Geography and Environmental Management, Faculty of Social Sciences, University of Port Harcourt, Port Harcourt, Nigeria
Biography: Olanrewaju Lawal is a Professor at the university of Port Harcourt, Port Harcourt, Nigeria, Faculty of Social Sciences, Department of Geography and Environmental Management, he has published over 30 journals and manual scripts and he is also an environmentalist and he is a research oriented guru.
Chemistry Department, School of Basic Sciences, Njala University, Moyamba, Sierra Leone
Biography: Umaru Kanneh is a lecturer at Njala University Sierra Leone. 80% of is time is allocated to teaching, research and community service. He was born in Daru Town Eastern Sierra Leone on the 14th April, 1984. He grew up in Daru Town, at the age of ten He was enrolled in Junior Secondary School (JSS1) at Wesley Secondary School Segbwema, seven miles from Daru. During this period there was rebel war in Sierra Leone, and Kailahun District was the headquarter of the rebels. As a result, their schooling was frequently interrupted. In 1999. He transferred to the regional head quarter town Kenema to pursue his Senior Secondary School (SSS1). He has both BSc. Chemistry Education (2002) and MSc.in Environmental Chemistry, (2013) both from Njala University.